30 Nov

Q3 GDP

General

Posted by: Bill Yeung

Q3 Canadian GDP Growth Slowed On The Back of Weak Housing and Business Investment

This morning, Stats Canada released the third quarter GDP figures indicating an expected slowdown to 2.0% growth (all figures quoted in annual rates), compared to a 2.9% pace in Q2. Over the first three quarters of this year, quarterly growth has averaged 2.2% which is down from the 3.0% annual growth recorded in 2017. The Canadian economy is at or near full capacity, so slower growth is not a bad thing.

However, while the headline growth of 2.0% was on trend, the details of the report are troubling. The bulk of the growth last quarter came from a contraction in imports–hardly a sign of a robust economy–leaving final domestic demand–which excludes trade–negative for the first time since early 2016. The softness in imports reflected a contraction in refined energy products as well as aircraft and other transportation equipment.

The NAFTA trade battle over the summer took its toll on the economy as households and businesses sharply curtailed their spending. Consumer spending grew at its slowest pace in more than two years, while businesses posted an unexpected drop in investment and trimmed inventories. Consumer spending moderated, as overall household consumption rose just 1.2%, held back by durable goods spending (-2.7%) as Canadians bought fewer vehicles for a third straight quarter.

The biggest surprise in the report was the sharp decline in non-residential business investment (-7.1%). Spending on non-residential structures fell 5.2%, while machinery and equipment spending, which includes computer software and hardware, plunged at a 9.8% annual rate. Business spending was weighed down by softer oil and gas investment.

Though residential investment was expected to decline, the reported 5.9% drop in Q3 was more significant than expected. Despite an uptick in home sales activity, residential investment weakened as both new construction of housing and renovation activity pulled back (see Note below). Investment in new residential construction posted its largest decline since the second quarter of 2009 when the financial crisis was hammering the global economy. The uptick in home sales was reflected in a sharp uptick in ownership transfer costs, which includes real estate commissions, land transfer taxes, legal fees and file review costs (inspection and surveying).

On the income side, compensation of employees rose 2.7% (4.0% on a year-on-year basis), leaving overall wage gains over the quarter at a modest 2.2% year-on-year. The household savings rate rose to 4.0% from an upwardly revised 3.4% in Q1.

Looking at the monthly data for September, there was not much momentum going into the final quarter of this year. Monthly GDP in September declined -0.1% as just half of major industries expanded. It was mainly down in goods production (-0.7%) as oil and gas extraction pulled back, hit in part by maintenance work. Substantial gains in services (+0.2%) were not enough to keep the headline in positive territory.

The projected further weakening in Q4 will be abetted by the transitory downward impact from the recent postal strike. The risks are on the downside for the Bank of Canada’s forecast of 2.3% growth in the final quarter of this year. Currently, it appears that growth in Q4 will be closer to 1% than 2%.

Implications for the Bank of Canada

The headline 2% growth rate was spot on the Bank of Canada’s expectation, but certainly, the Bank will note the weakness in the underlying data. Potentially more important is the deep reduction in the price of oil for Canadian producers already struggling with transportation bottlenecks that have been pummelling the energy sector and depressing growth in Alberta. Cuts in oil production are likely to hit economic activity in the current quarter, with a full recovery not expected until at least mid-2019.

As well, the GM shutdown in Oshawa, Ontario raises concerns about the viability of the Canadian auto industry and adds to the weakness in the economic outlook. The two largest export sectors in Canada are energy and autos, so weakness in these sectors will keep the Bank of Canada on the sidelines in December, notably as consumers may well be tapped out. Markets had been expecting a rate hike in January, but the latest data suggest that the prospects of such a move have dropped significantly.

Notes:

*Housing investment in the GDP accounts is technically called “Gross fixed capital formation in residential structures”. It includes three major elements:

  • new residential construction;
  • renovations; and
  • ownership transfer costs.

New residential construction is the most significant component. Renovations to existing residential structures are the second largest element of housing investment. Ownership transfer costs include all costs associated with the transfer of a residential asset from one owner to another. These costs are as follows:

  • real estate commissions;
  • land transfer taxes;
  • legal costs (fees paid to notaries, surveyors, experts, etc.); and
  • file review costs (inspection and surveying).
Dr. Sherry Cooper
Chief Economist, Dominion Lending Centres
drcooper@dominionlending.ca
15 Nov

home Sales Statistics

General

Posted by: Bill Yeung

Canadian Home Sales Weakened In October

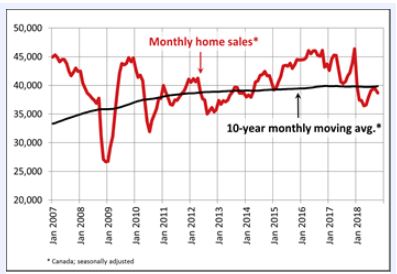
Statistics released today by the Canadian Real Estate Association (CREA) show that national home sales declined for the second consecutive month in October, edging back by 1.6% month-over-month (m/m) and down 3.7% from year-ago levels. Year-over-year sales in October are now about in line with their 10-year monthly average (see chart below). Existing home sales activity has picked up from levels early this year, but it is still considerably below the boom days of 2016 and early-2017 before the foreign purchase tax was introduced in Ontario (in April 2017), the new OSFI rules were implemented (in January 2018), and Bank of Canada tightening gained momentum.

Home transactions last month declined in more than half of all local markets, led by Hamilton-Burlington, Montreal and Edmonton. Although activity did improve modestly in many markets, it was offset by a decline in sales elsewhere by a factor of two. On a year-over-year (y/y) basis, sales were down in slightly more than half of all local markets as lower sales in Greater Vancouver and the Fraser Valley more than offset the rise in sales in the Greater Toronto Area (GTA) and Montreal by a wide margin.

New Listings

The number of newly listed homes edged down 1.1% between September and October, led by the GTA, Calgary and Victoria. The decline in new supply among these markets more than offset an increase in new supply in Edmonton and Greater Vancouver.

As for the balance between sales and listings, the national sales-to-new listings ratio in October came in at 54.2% — close to September’s reading of 54.4% and its long-term average of 53.4%. Based on a comparison of the sales-to-new listings ratio with the long-term average, about two-thirds of all local markets were in balanced market territory in October 2018.

There were 5.3 months of unsold inventory on a national basis at the end of October 2018. While this remains in line with its long-term national average, the number of months of inventory is well above its long-term average in the Prairie provinces and in Newfoundland & Labrador, where downward pressure on home prices is likely to continue. By contrast, Ontario and Prince Edward Island are the two provinces where the measure remains more than one standard deviation below its long-term average pointing to stable prices or modest gains. In other provinces, the number of months of inventory is closer to its long-term average and suggests that sales and inventory are well balanced.
Home Prices

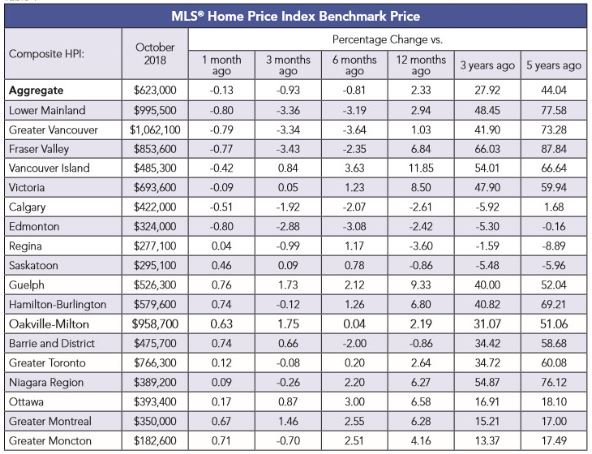
The Aggregate Composite MLS® Home Price Index (MLS® HPI) was up 2.3% y/y in October 2018 with similar gains posted in each of the three previous months.

Following a well-established pattern, condo apartment units posted the largest y/y price gains in October (+7.4%), followed by townhouse/row units (+3.9%). By comparison, one-storey single-family homes posted a modest increase (+0.6%) while two-storey single-family home prices held steady.

Trends continue to vary widely among the 17 housing markets tracked by the MLS® HPI. In British Columbia, home price gains have been diminishing on a y/y basis (Greater Vancouver: +1%; Fraser Valley: +6.8%; Victoria +8.5%; elsewhere on Vancouver Island: +11.8%). Vancouver’s market balance is the weakest in almost six years, and prices for both condos and single-detached homes are now falling outright (the former were previously sturdy).

By contrast, MLS® HPI benchmark price comparisons are improving on a y/y basis among housing markets in the Greater Golden Horseshoe (GGH) region of Ontario that are tracked by the index. Home prices were up from year-ago levels in Guelph (+9.3%), Hamilton-Burlington (+6.8%), the Niagara Region (+6.3%), the GTA (+2.6%) and Oakville-Milton (+2.2%). While home prices in Barrie and District remain slightly below year-ago levels (-0.9%), declines there are shrinking; if current price momentum persists, home prices in December are on track to turn positive compared to December 2017.

Across the Prairies, benchmark home prices remained below year-ago levels in Calgary (-2.6%), Edmonton (-2.4%), Regina (-3.6%) and Saskatoon (-0.9%).

Home prices rose by 6.6% y/y in Ottawa (led by a 7.4% increase in two-storey single-family home prices), by 6.3% in Greater Montreal (driven by a 9.8% increase in townhouse/row unit prices) and by 4.2% in Greater Moncton (led by a 12.4% increase in townhouse/row unit prices) (see table below).

Bottom Line

Housing markets continue to adjust to regulatory and government tightening as well as to higher mortgage rates. The speculative frenzy has cooled, and multiple bidding situations are no longer commonplace in Toronto and surrounding areas. The housing markets in the GGH appear to have bottomed. However, prices still look soggy at the higher end of the single-family home market.

The slowdown in housing markets in the Lower Mainland of BC accelerated last month as the sector continues to reverberate from provincial actions to dampen activity, as well as the broader regulatory changes and higher interest rates.

We are likely in store for a prolonged period of modest housing gains in the Greater Golden Horseshoe, stability or softening in British Columbia and further weakening in the Prairies, Albert, and Newfoundland & Labrador.

Montreal and Ottawa remain the areas of relative strength among the biggest cities. Sales dipped in both cities month-over-month in October, but they are both up a solid 11% from a year ago. In Montreal, we’ve seen some evidence that increased foreign buying activity is mixing with strong domestic fundamentals, pushing benchmark prices up 6.3% y/y. Ottawa has been boosted by a wave a federal government spending and hiring, with price growth similarly running at 6.6% y/y, though now softening from its recent high.

The Bank of Canada is expected to continue gradually tightening monetary policy. Residential mortgage credit growth has slowed to a 17-year low and, for the first time in a decade, borrowers will be refinancing 5-year fixed rate mortgages at higher interest rates.

Bank Of Canada Reports Dramatic Drop in Highly Indebted Borrowers

In a separate report, the Bank of Canada announced this week that the quality of new mortgage lending in Canada had improved markedly owing to tighter mortgage qualification rules and higher interest rates, both of which have pushed marginal buyers out of the market. This was Ottawa’s intention all along in its multiple initiatives to dampen the housing market over the past several years.

The share of new mortgages going to highly indebted borrowers–those with loan-to-income ratios of above 450%–dropped to 13% in the second quarter of this year, down from more than 18% last year. Hence, the Bank believes that there is strengthening resiliency in the financial system, aided in part by an improving economy that has prompted five rate increases since the middle of last year.

The Bank of Canada report on the mortgage market found that not only are the number of new mortgage borrowers declining, but the riskiest ones are being weeded out. The number of new uninsured borrowers considered highly-indebted fell by 39% in the second quarter from year-ago levels, with Toronto posting the most significant declines.

The Bank also commented that the tighter regulations have had one side effect–shifting market share away from the country’s six biggest banks to other institutions such as credit unions and private lenders, which they see as a potential new source of risk. The overall riskiness of new mortgages has decreased “because the proportion of risky borrowers has declined across cities,” the report found. “As well, the regional composition has shifted, with a somewhat larger share of new mortgages recently coming from areas outside Toronto and Vancouver.”
Dr. Sherry Cooper
Chief Economist, Dominion Lending Centres
drcooper@dominionlending.ca
2 Nov

JOB! JOBS!!JOBS!!!

General

Posted by: Bill Yeung

Canadian employment increased less than expected in October, as wage growth slowed.
View this email in your browser
Dr. Sherry Cooper
This announcement available in Autopilot as “SC 20181102 Canadian Jobless Rate Fell To 40-Year Lows”

French translation of this email will be available by 5pm ET Friday Nov. 2.
La traduction en français de cet e-mail sera disponible avant 17 h HE Nov. 2.

Canadian Jobless Rate Fell To 40-Year Lows

Canada posted moderate employment gains as the unemployment rate dipped once again to historically low levels, which was the result of fewer people look for work. Despite very tight labour markets and rising job vacancy rates, wage growth weakened in October.

Statistics Canada released data today that showed a moderate 11.2k gain in employment, but also a falling labour force, which was down 18.2k. In consequence, the jobless rate fell back to 5.8% in October, matching a four-decade low. This is consistent with just under 2% economic growth as the Bank of Canada expects. This modest gain in employment suggests the Bank will hold interest rates steady in December, especially given that wage gains have slowed for the fifth consecutive month.

Continuing the see-saw pattern of late, full-time employment was in the driver’s seat, with 33.9k net positions added. Part-time work fell 22.6k. The overall gains were driven by the private sector (+20.3k) as public sector employment pulled back (-30.8k), leaving a 21.8k gain in self-employment.

These indicators are consistent with business surveys that are getting louder in their complaints that it’s difficult to find workers. But there is little evidence that firms are offering better pay to attract and retain employees. Wages were up 2.2% from a year ago, the slowest pace in more than a year and down from as high as 3.9% earlier this year. Wage gains for permanent workers were 1.9%, also the slowest in more than a year. This reduces the likelihood of a rate hike in December. The Bank of Canada’s wage common measure has been more stable at 2.3% so far this year. This is a better indicator of the underlying trend, but no doubt it’s still short of what we would expect at this point in the cycle.

Also, the participation rate fell to 65.2% last month, the lowest level in 20 years as the labour force increased by just 62.5k so far this year–one of the smallest 10-month gains in recent history. It is notable, however, that the participation rate for 25-54 year-olds–the core labour force–rose to a record high.

On a regional basis, employment rose slightly in Saskatchewan, while there was little change in all the other provinces (see table below).

More people were employed in business, building and other support services; wholesale and retail trade; and health care and social assistance. In contrast, there were fewer workers in “other services;” finance, insurance, real estate, rental and leasing; and natural resources. Employment in finance, insurance, real estate, rental and leasing declined by 15,000 in October, offsetting an increase the month before. On a year-over-year basis, employment in the industry was little changed as housing starts, and resales have slowed, especially in B.C. and Ontario.

Bottom Line: Income growth will be crucial in enabling households to manage debt loads in a rising rate environment and by extension a key determinant of the pace of future Bank of Canada interest rate hikes. Today’s jobs report along with other less timely data suggest the Bank of Canada will refrain from raising interest rates in December.

US Posted A Strong October Jobs Report

Hiring rebounded sharply last month in the US as non-farm payrolls added 250k new jobs, compared to 118k in September, which was restrained by disruption from Hurricane Florence. The unemployment rate held at its cycle-low 3.7%.

The closely watched measure of wage growth–average hourly earnings– rose 0.2% on the month. On a year-over-year basis, wages in the US were up 3.1%, a new post-recession high.

This is an unambiguously positive report. Hiring bounced back from a hurricane-dampened September. The number of Americans with jobs relative to the population reached a new post-recession high. And, perhaps most notably, wages continue to make progress.

With the Fed just having moved in September, we are not anticipating another hike at next week’s FOMC meeting as the central bank adheres to a gradual pace of tightening. However, our forecast does anticipate a 25-basis point increase at the next policy meeting in December followed by similar-sized hikes every quarter through next year. This results in the upper end of the fed funds rate range finishing 2019 at 3.50% compared to 2.25% currently.

Dr. Sherry Cooper
Chief Economist, Dominion Lending Centres
drcooper@dominionlending.ca